The Consumer Finance Protection Bureau (CFPB) included a number of new datapoints in the 2018 release of the Home Mortgage Disclosure Act Data (HMDA), which came out in September 2019. Among these new datapoints are the interest rate and rate spread, which identify the interest rate at the time of closing on a home purchase and the difference between that rate and the average publish rate for other loans that closed on that same day. The CFPB published a guide to explain the variables that are included in the dataset.
Both of these data fields have a number of outlier records that can complicate the calculation of averages if one is included in your sample data. For HMDA researchers, these outliers are a latent threat to the accuracy of their analysis and should be approached with caution.
Outliers in the dataset can change the average figure and misrepresent the true nature of the data being analyzed. Our initial analysis indicated the presence of outlier data, as the average interest rate and rate spreads were far larger than our experience suggested was accurate. Among interest rates reported on originated loans, there were 1,365 reported rates over 15%. One reported an interest rate of 260,000%. This is clearly an error, and while it is the most extreme example there are several hundred records with rates that are substantially higher than what would seem to be realistic.
For rate spreads, the lender reports the percentage above or below the daily average as a positive or negative decimal. For applications that did not result in an origination, the rate spread and interest rate data is either missing or of questionable value so we limit our outlier analysis to originated loans. In 2018, among originated loans, there were 51,489 loans with rate spreads over 5% from the average on the day of closing. A number of these rate spreads were over 100% higher or lower than the average. Twelve were reported to be 9999997% below average! Clearly, these are errors and although the extreme examples are rare, if one falls into the dataset a researcher has selected for analysis it can skew results in ways that are not immediately apparent.
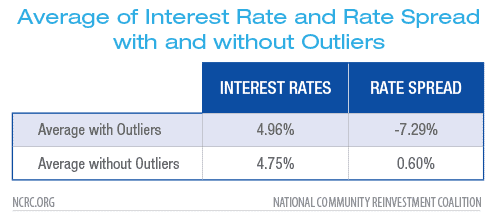
 Table 1: Notes – 2018 HMDA Single family owner occupied home loan originations (N = 6,757,052). Interest Rate outlier N = 536. Rate Spread outliers N = 86,749.
To eliminate these outliers we first visualized them and verified that both the rate spread and interest rate variables are generally normally distributed. We were able to confirm the existence of the outliers in the rate spread and interest rate fields using a SQL query on HMDA data collected in 2018. We determined this by using a joint-compliance method on both fields by adding a limiter that filters out excessive values. The mean and standard deviations were then calculated on both fields with and without this limiter. Another factor that seems to be prevalent in the HMDA 2018 data is the value ‘1111.’ This value is an indicator, added in by the CFPB, which signifies an ‘Exempt’ definition and is scattered across the entire dataset. The technical difficulties this could bring reside within integer and numeric fields, such as the rate spread and interest rate fields, where the value ‘1111’ would be identified as part of the numeric spread of the data rather than an indicator. This can be seen in the mean and standard deviation calculation comparison within both fields, shown below. The coded value’s definition can be found in this PDF on CFPB’s website. The page also notes that several other numeric coded values have been added into the dataset (e.g. ‘7777’, ‘8888’, ‘9999’). We strongly urge further anticipation of these coded values within the HMDA 2018 dataset.
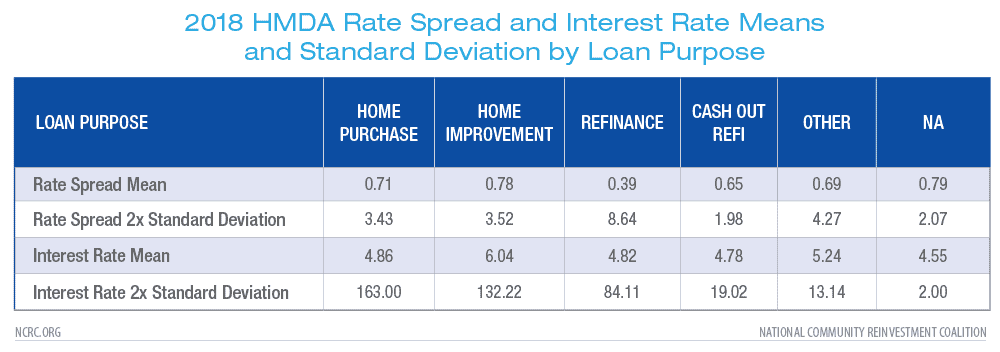
Mean and standard deviation figures were calculated separately for records based on loan purpose. Home equity and home improvement loans often have much higher interest rates and rate spreads than home purchase or refinance loans, so filtering must be done at the individual loan purpose level. The following mean and 2x standard deviation figures were used to filter the data.
After identifying outliers we were able to eliminate .03% of originations based on the interest rate and 1.6% of originations based on rate spread. Results of our analysis after screening out these outliers show a substantial difference, indicating the previous results were skewed by the presence of these outliers.
Hopefully, future HMDA releases will be subject to more scrutiny and lenders will be asked to justify results that fall outside of the expected range.
Jason Richardson is NCRC’s Director of Research & Evaluation.
Jad Edlebi is NCRC’s GIS Specialist.


